Key questions
- What is the difference between distance and displacement and speed and velocity?
- How is average velocity determined?
- What is uniform motion like?
Motion is a part of countless natural phenomena. The Earth revolves around the Sun, people move on the Earth’s surface, and the molecules in the atmosphere are in constant motion. If we want to measure motion, we simply need a pre-determined distance and a stopwatch. We can use the distance and the watch to determine an object’s position at different times and then use the data to calculate different quantities related to motion, such as velocity and acceleration.
Determining an object’s motion requires a reference point that the motion is studied against. The reference point can be a starting line at a running track or a location that you are travelling to, for example. In a coordinate system, the reference point is the origin. Motion changes the position relative to the origin. The change can be presented graphically with a position-time coordinate system. This presentation method is also called a position vs. time graph. In the video below, the researchers use an ultrasonic sensor to measure the motion of a remote-controlled car. The sensor measures the car’s distance relative to the probe. The starting point of the car is used as the origin, and the initial direction of the motion is considered the positive direction.
The change in position is displacement . Displacement is the difference between the final distance () and the initial position (). Displacement represents the shortest distance between the end point and starting point: it shows the direct path from the start to the end. The (delta) symbol shows that we are talking about a change in position, not just one position.

Because motion can occur in different directions, displacement can be positive or negative. To determine whether displacement is positive or negative, we must study how an object has moved relative to the reference point. If nothing has pre-determined which direction is positive or negative, you can choose the positive direction yourself.
The term that we use to talk about motion in everyday language is distance. Displacement is determined based on a position’s starting point and end point. When an object moves between the starting point and end point, it can take very arbitrary paths. Distance accounts for how long the real path of the object was. Distance represents the length of a travelled path and is always positive.
Reciprocating motion always returns to the starting point. This type of motion occurs e.g. when a lift moves to the top floor of a building and then back to the floor it started from. If the distance between two floors is 5 m, the distance that the lift travelled during reciprocating motion is 10 m. However, the displacement is 0 m, because the lift ends up back at the starting point.
An object’s displacement () represents the object’s change in position: , where is the object’s initial position and is the object’s final position.
Distance is the length of the path that the object travelled. Distance is always a positive value.
Velocity () represents a change in position relative to time. The average velocity () of an object is the ratio of displacement and the time it took to achieve the displacement. Average velocity is only affected by how great the displacement was and how much time it took, so it does not show possible changes in velocity during the displacement. By calculating the average velocity, we can find out what velocity an object would have moved at if the velocity had remained constant. Like displacement, the average velocity value can be either positive or negative. The positive or negative prefix of velocity value shows the direction of motion relative to the origin. Now, let’s apply what we have learned so far to the remote-controlled car we saw in the video above. We will use the motion graph of the car to determine its displacement and average velocity between two different points in time.

Data
Table: The-motion-of-a-remote-controlled-car.ods (LibreCalc)
Table: The-motion-of-a-remote-controlled-car.cmbl (Logger Pro)
Displacement A from point to occurs from 2.0 s... 4.0 s and is 0.21 m. Therefore, the average velocity is
Displacement B from point to occurs from 4.0 s to 8.0 s and is -0.51. Therefore, the average velocity is
Velocity is a quantity that represents motion: it accounts for the magnitude and direction of the motion. Speed is a quantity that only represents the magnitude of motion. The speed of a remote-controlled car is always positive regardless of whether the car moves to the left or the right. To calculate the average speed, divide the distance with the time it took to travel: . Using the same points from above, the average speed of the remote-controlled is 0.11 m/s at point A and 0.13 m/s at point B.
Velocity represents an object’s change in position relative to time.
The average velocity of an object () is the displacement divided by the time it took to achieve the displacement.
The average speed of motion is the distance divided by the time it took to travel, or . Speed does not have a standardised symbol for its quantity.

The simplest model of motion is uniform motion. There are many cases of natural motion that can be modelled as uniform motion. Light moves with uniform motion, and so do trains, at least approximately. Uniform motion can also be seen in the video below, where two low-friction carts travel along the tracks.
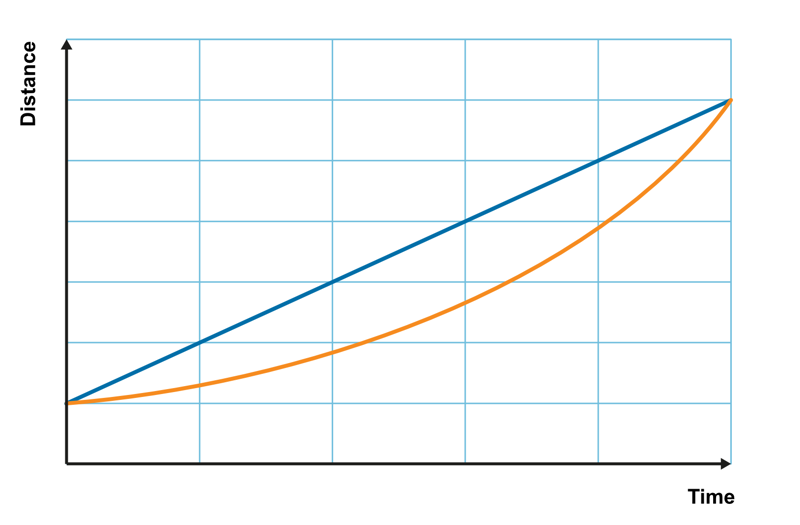
The position-time graph below shows the carts’ motion in a coordinate system. The graph shows straight, rising lines during the motion. This means that the position changes uniformly. In other words, it changes by the same magnitude every second. Looking at the graph, we can see that the red cart (cart 1) had a velocity of 0.31 m/s, meaning that it moved 0.31 m every second.
The blue cart had a higher velocity than the red one. This is indicated by the steeper line, which shows that the blue cart’s position increases faster. Velocity equals the change of position divided by the elapsed time, so the velocity is the position graph’s slope. The faster blue cart has a steeper slope than the red cart.

Data
Table: Uniform-motion.ods (LibreCalc)
Table: Uniform-motion.cmbl (Logger Pro)
1. Which line represents greater displacement in the graph above?
2. Which line represents a greater average velocity throughout the entire observation period?
3. Which graph indicates a constant velocity?
4. A car is moving down a straight road. Which of the following statements is true?
In uniform motion, the position graph shows a straight line. The slope of the line, then, represents the velocity of the object. During uniform motion, velocity always remains constant, so the determined velocity and average velocity are equal as well. The slope is determined from the measurement data by using an appropriate analysis software and fitting a line to the selected data points.
The mathematical formula for a line that intersects with the origin in an coordinate system is , where is the slope of the line. In the line’s general form, represents the vertical axis. In a position graph, the axis denotes a specific position, which is marked with in the mathematical formula. By contrast, represents the horizontal axis. The horizontal axis of the position graph denotes time, . The slope represents the motion’s velocity, . Therefore, the mathematical formula that represents uniform motion is , assuming that the object is at the origin when we begin observing it.
If a uniformly moving object is not at the origin at , the equation is , where is the position at the start of observation.
Velocity remains constant in uniform motion. The velocity of uniform motion is determined using a position-time graph’s slope. The mathematical model for velocity in uniform motion is
An object’s position in uniform motion is calculated using the formula
In everyday life, one second is a short time and one metre is a short distance for certain situations involving motion. In traffic, distance is measured in kilometres and time in hours. The derived unit for velocity is km/h. The units can be converted as follows:
and
Change m/s → km/h
Change km/h → m/s
A person walked down a corridor. The person’s position was measured using a motion detector ultrasonic sensor. The measurement results are presented below in different file formats. Draw or open the person’s position-time graph, and use the graph to answer the following questions.
Data
Table: Walking-speed.ods (LibreCalc)
Table: Walking-speed.cmbl (Logger Pro)
a.
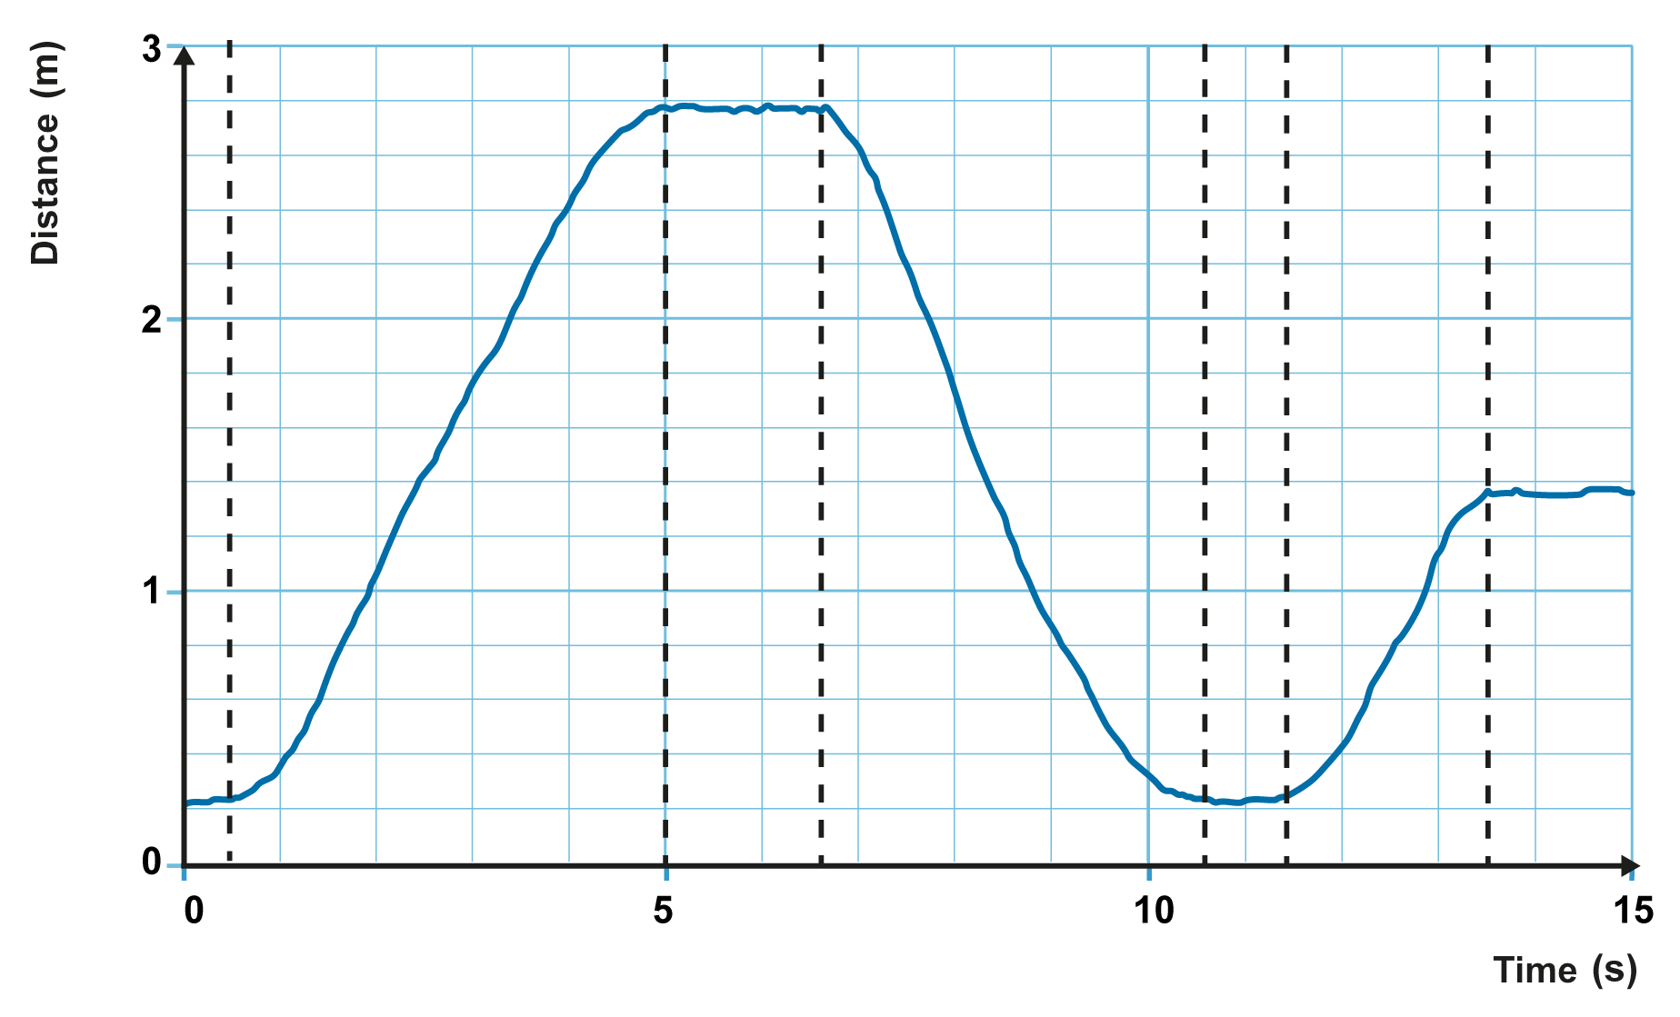
The person moves forward when the position graph’s line rises and backwards when the line falls. Based on the graph, the person moved forward from 0.5 s to 5 s and 11.5 s to 13.5 s.
The person moved backwards from 6.5 s to 10.5 s.
The graph has vertical lines which indicate when the person starts moving or stops.
The person moved forward from 0.5 s to 5 s and 11.5 s to 13.5 s. They moved backwards from 6.5 s to 10.5 s.
b. The displacement equals the difference between the final position and starting position, meaning 1.3 m – 0.2 m = 1.1 m.
The distance can be determined by adding up the reciprocating displacement quantities (absolute values). Therefore, the distance is
The displacement during the entire measurement period is 1.1 m, and the travelled distance is 6.1 m.
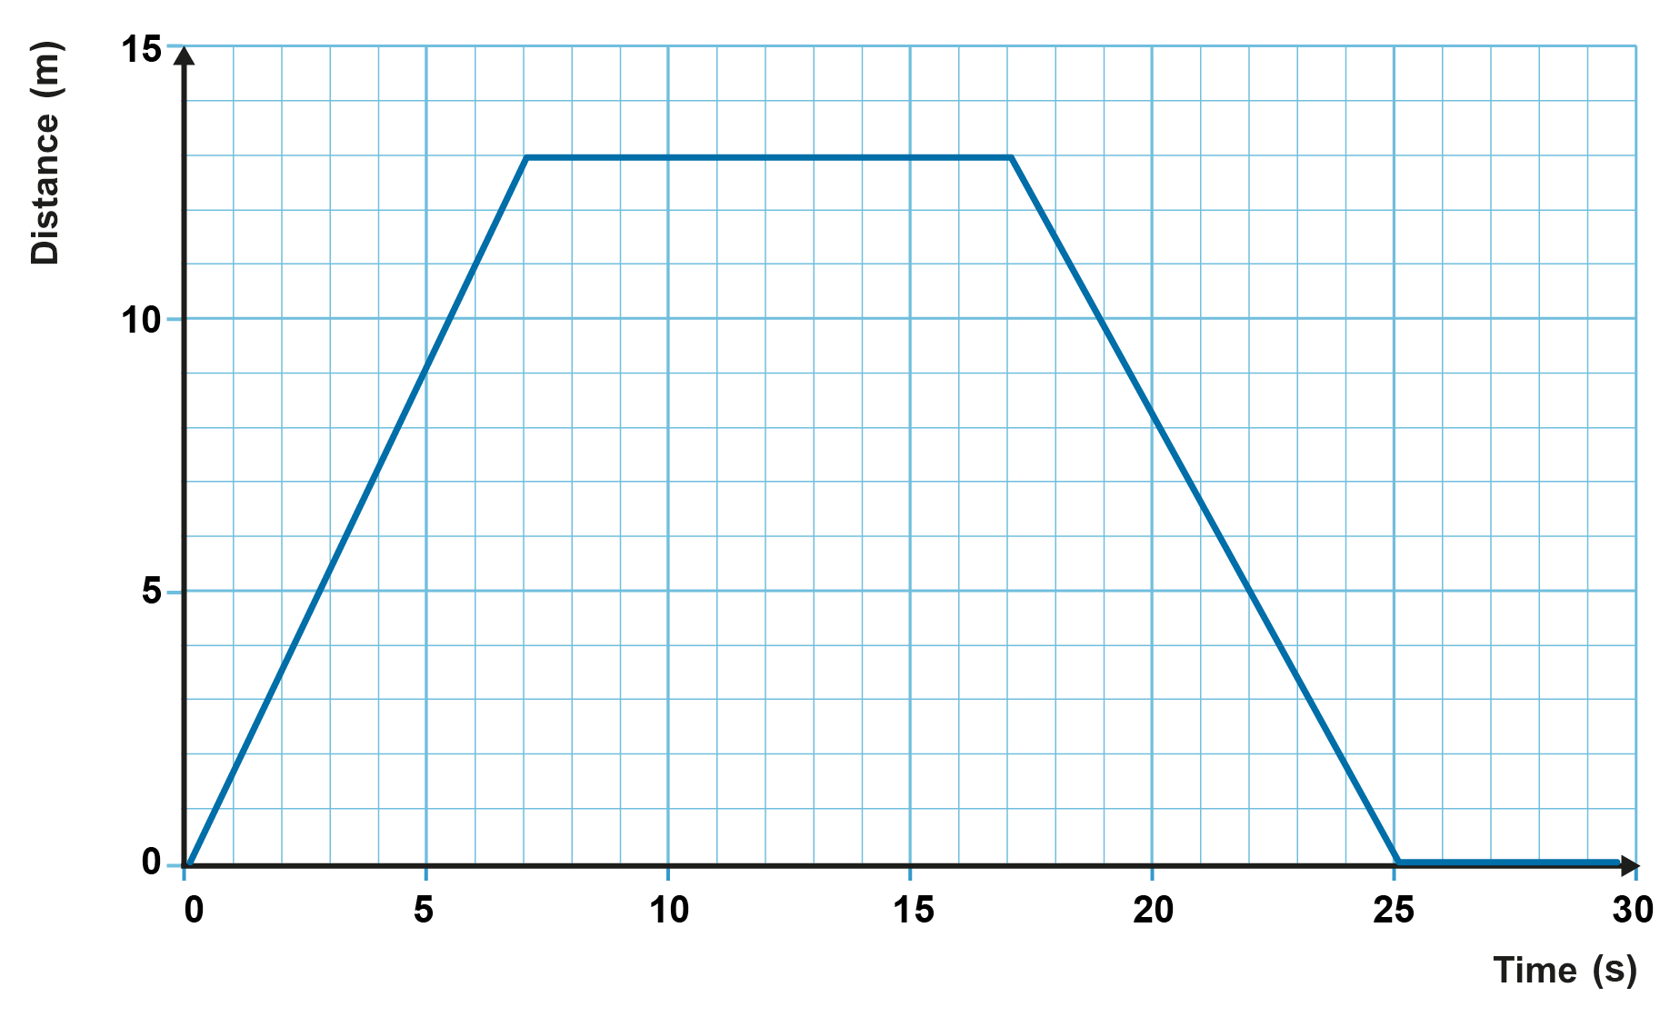
Read the required values from the graph and determine
a. Displacement:
Distance:
b. The average velocity can be determined using the velocity and time values at the end points of the observation period.
c. At 20 s, the graph is straight, so the motion is uniform. The velocity is the graph’s slope.
a. The average velocity can be calculated by using the units kilometre and hour. It takes 51 minutes to travel from Berlin to Leipzig. In hours, this is
The average velocity is
b. Determine the time from the average velocity
Use the value 124.71 km/h for average velocity (intermediate value, includes more significant digits than the final answer):
The train arrives in Altenburg at 5:36 p.m.
Unfurl a tape measure that is at least 10 metres long and place it on the floor of a corridor. Place people to measure the time along the tape measure at 1-metre intervals. The people measuring the time must start their watches at the same time, while one person walks the measured distance. Each person measuring the time should stop their watch when the walker passes by them. This way, we get intermediate times for every metre walked. When the experiment is finished, write down all times in a single document.
Repeat the measurement using a few different people. Present the walkers’ movement as graphs in a position-time coordinate system. Calculate the average velocities for the people who took part in the experiment. Can the walks be considered uniform motion?
Set up the measuring tape vertically and drop a feather in a way that lets you see its position against the vertical measuring tape. Drop the feather and record a video of the experiment. Use the video to determine the feather’s position at appropriate intervals of your choosing and present the results in a position-time coordinate system. Was the feather’s motion uniform? If yes, determine the feather’s velocity when falling.
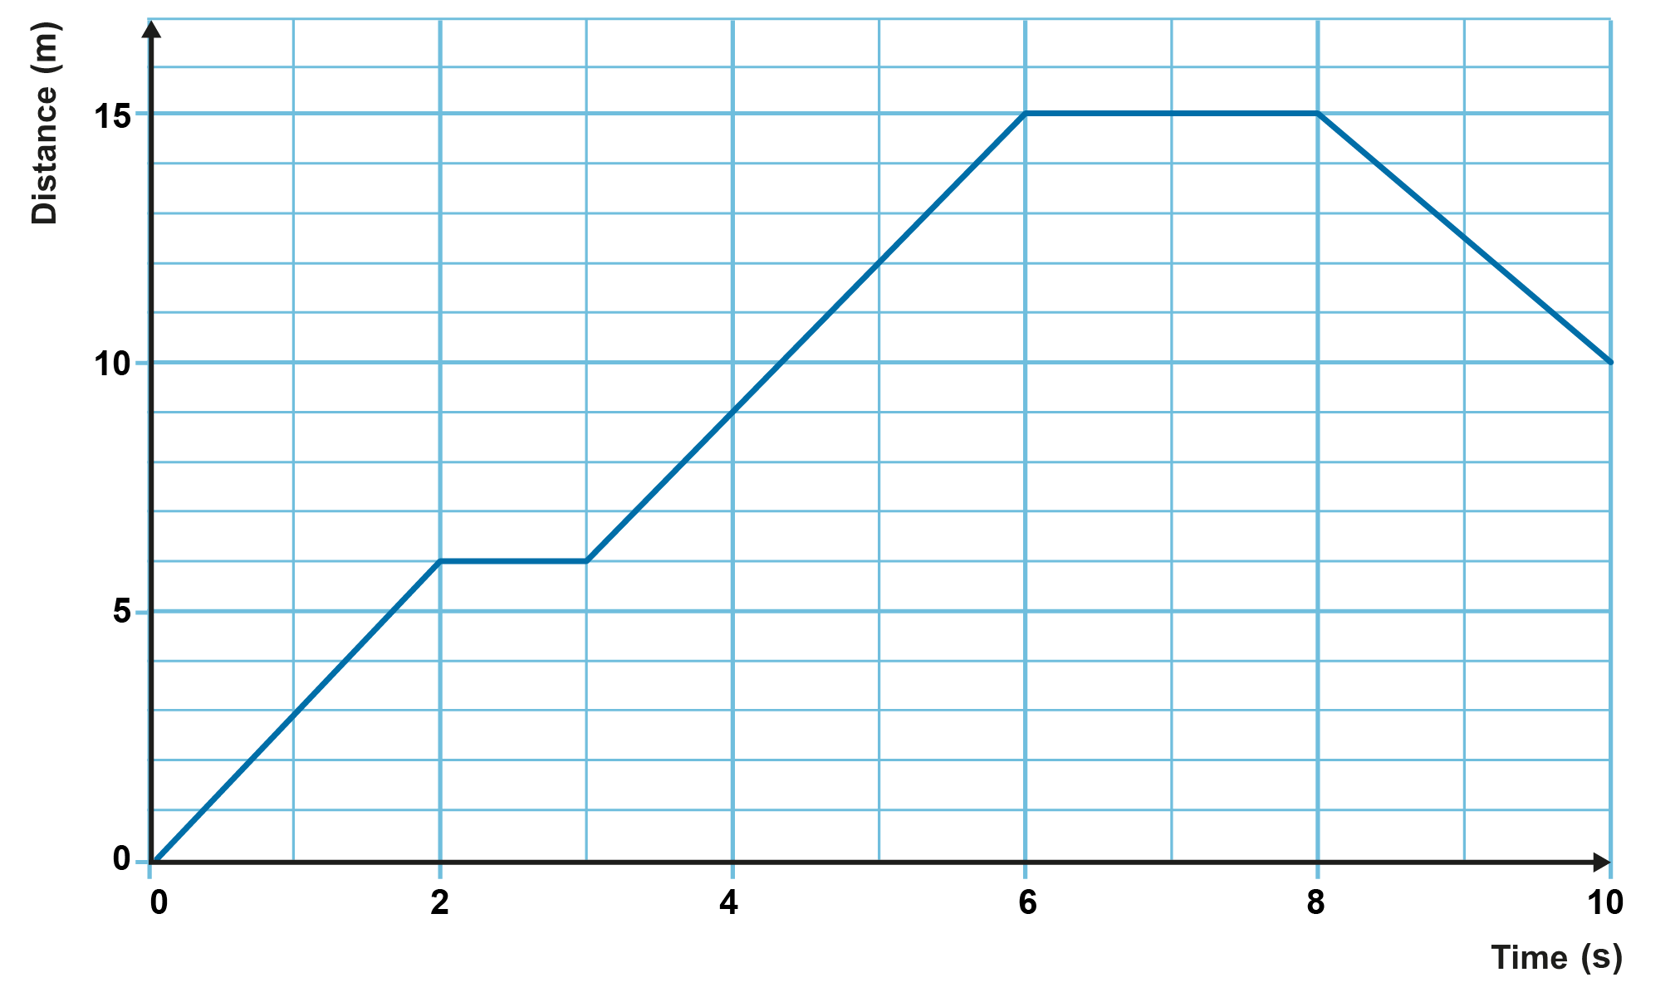
1. What is the student’s position at 2.0 s?
Give your answer in whole numbers: metres.
2. How great is the student’s displacement from 0 s to 10 s?
Give your answer in whole numbers: metres.
3. How great is the student’s travelled distance from 0 s to 10 s?
Give your answer in whole numbers: metres.
4. How great is the student’s average velocity from 0 s to 10 s?
Give your answer in whole numbers: metres per second.
5. How great is the student’s velocity from 3 s to 6 s?
Give your answer in whole numbers: metres per second.
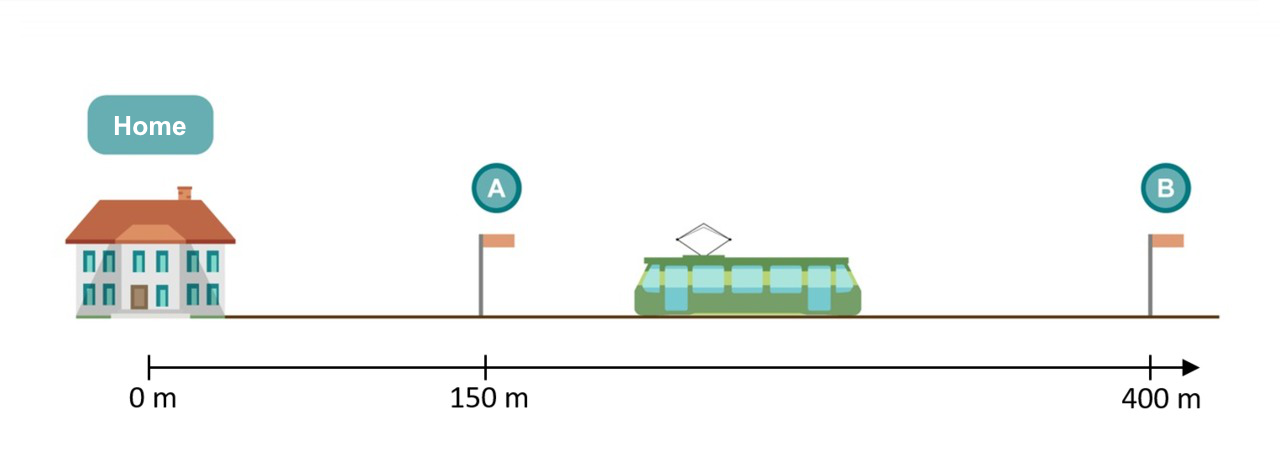
1. Masa runs from his home to tram stop A in 24 seconds. What was Masa’s average velocity, with an accuracy of two significant digits?
Answer: m/s.
2. Masa takes the tram from stop A to stop B at a velocity of 10 m/s. How long does his tram journey take, with an accuracy of two significant digits?
Answer: s.
3. Masa waited for the tram at stop A for 45 seconds. What was Masa’s average velocity throughout the entire journey from his home to stop B, with an accuracy of two significant digits?
Answer: m/s.
4. Masa walks back home from stop B. His average walking speed is 2.5 m/s. How long does Masa’s walk back home take, with an accuracy of two significant digits?
Answer: s.
5. What was Masa’s average velocity when he was walking home?
Answer: m/s.
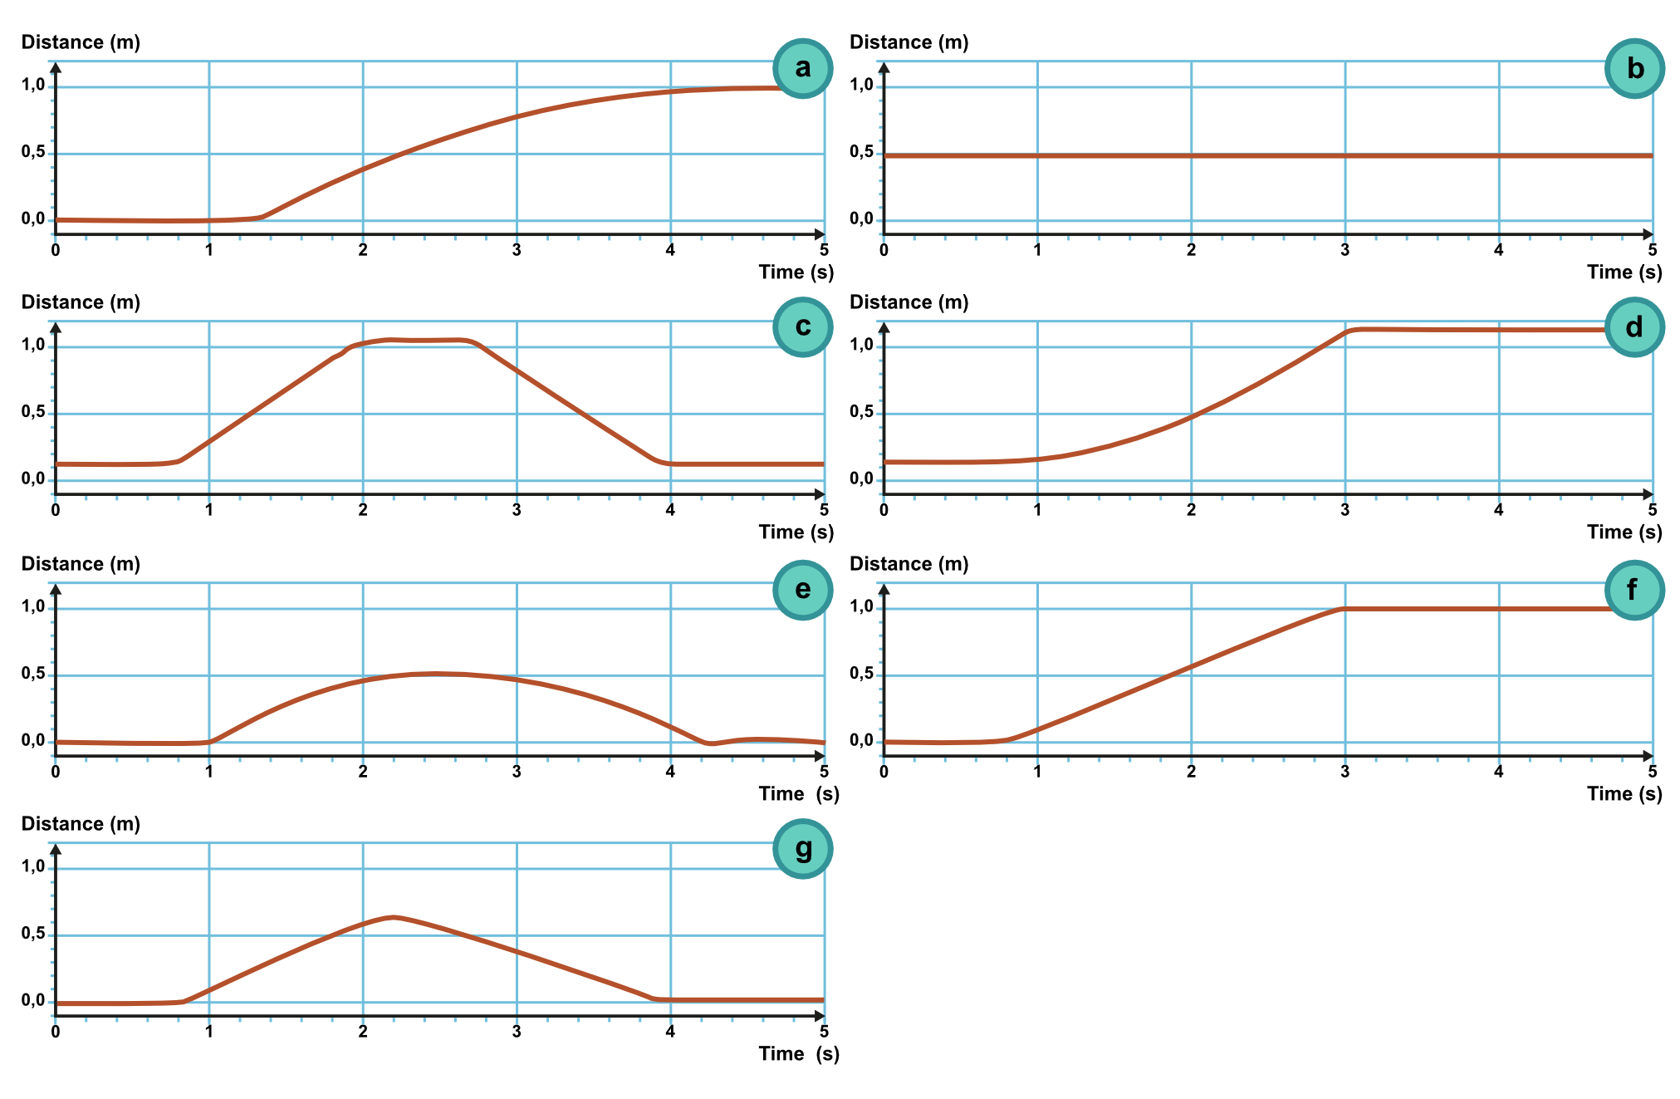
1. Motion 1:
2. Motion 2:
3. Motion 3:
4. Motion 4:
5. Motion 5:
Mitä haluat tehdä tekstillä? Teksti käsitellään tekoälyn avulla, eikä sitä sen jälkeen muokata tai tarkisteta. Tekstissä voi esiintyä virheitä. Tarkista tekstin oikeellisuus vertaamalla sitä kirjan alkuperäistekstiin.
Valitse tiedostot, jotka haluat lisätä. Tuetut formaatit ovat txt, html, htm, pdf, odt, odp, ods, xls, xlsx, ppt, pptx, pps, doc, docx, rtf, png, jpg, jpeg ja gif.
| Nimi | |
|---|---|
| poista |
Huom.! Linkkien tulee alkaa ”http://”!
Opiq käyttää verkkosivun toiminnan, turvallisen käytön varmistamisen, käytön analysoimisen ja parhaan käyttömukavuuden tarjoamisen edellyttämiä evästeitä.
Eväste on käyttäjän tietokoneelta verkkosivun palvelimeen lähetettävä pieni tiedosto, joka sisältää verkkosivun toiminnan edellyttämiä käyttäjää ja hänen tekemiä valintoja koskevia tietoja.
Isoin osa evästeistä ovat Opiqin toiminnan kannalta välttämättömiä. Analyyttisistä evästeistä voi luopua ja silloin ei sinun käyttötietojasi ei käytetä Opiqin kehittämiseen. Lue lisää